ML Introduction
Preprocessing
Regression
Classification
Simple Linear Regression
- Simple Linear Regression algorithm that models the relationship between a dependent variable and a single independent variable.
- The relationship is shown as linear or a sloped straight line.
Equation of Simple Linear Regression
$$ y = a_0 + a_1x + ε $$
- = dependent variable (target variable).
- = the intercept (on the y-axis) of a regression line.
- = the slope of a regression line (coefficient).
- = independent variable (predictor variable).
- = the model error.
Problem statement: Build a machine learning model that can predict home prices based on area.
- Predict the price of a home with an area of 2900 sqr ft.
- Predict the price of a home with an area of 3100 sqr ft.
- Predict the price of a home with an area of 4100 sqr ft.
import pandas as pd
from sklearn.linear_model import LinearRegression

df = pd.read_csv("homeprices.csv")

x = df[["area"]].values
y = df["price"]

linear_regressor_model = LinearRegression()
linear_regressor_model.fit(x, y)

print(linear_regressor_model.predict([[2900]]))
print(linear_regressor_model.predict([[3100]]))
print(linear_regressor_model.predict([[4100]]))
[574400.68493151]
[601558.21917808]
[737345.89041096]
# Cross verify using Simple Linear Regression formula.

def predict_using_formula(x):
    a0 = linear_regressor_model.intercept_
    a1 = linear_regressor_model.coef_
    y = a0 + a1 * x
    print(y)

predict_using_formula(2900)
predict_using_formula(3100)
predict_using_formula(4100)
[574400.68493151]
[601558.21917808]
[737345.89041096]
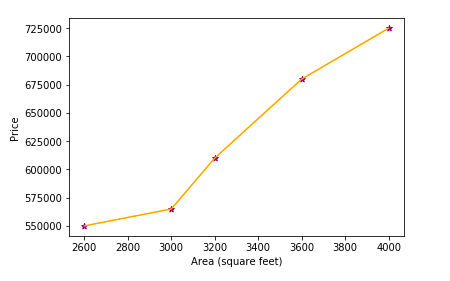
Problem statement: Draw a scatter plot and show the area-wise price distribution of homes.
import matplotlib.pyplot as plt

plt.xlabel("Area (square feet)")
plt.ylabel("Price")
plt.scatter(x, y, color="purple", marker="*")
plt.plot(x, y, color="orange")