ML Introduction
Preprocessing
Regression
Classification
Data Preprocessing in Machine Learning

Data Preprocessing in Machine Learning
Data Preprocessing in Machine Learning
Data preprocessing is a crucial step in the machine learning pipeline.
It involves transforming raw data into a clean and usable format to improve the performance and accuracy of machine learning models.
Key steps involved in data preprocessing are Cleaning, Integrating, Transforming, Feature Selection, Feature Extraction, and Data splitting.
Data Cleaning
Purpose: To identify and correct errors or inconsistencies in the data.
Data Cleaning Steps:
- Handling Missing Values: Missing data can be dealt with by Removing and Imputation.
- Removing means Deleting rows or columns with missing values (if they are few and insignificant).
- Imputation means Replacing missing values with mean, mode, median, or using more sophisticated methods like K-Nearest Neighbors (KNN) imputation.
- Removing Duplicates: Identifying and removing duplicate entries to avoid bias in the model.
- Outlier Detection and Removal: Identifying outliers that can skew the results and deciding whether to remove or transform them.
First, download CSV file
Read CSV file
Using the read_csv() function from the panda's library read the CSV file.
Provide CSV file name in read_csv() function:
If your CSV file is located in the same folder as your notepad file, provide only the name of the CSV file; otherwise, provide the full path to the read_csv() function.
import pandas as pd

df = pd.read_csv("home_prices.csv")

df
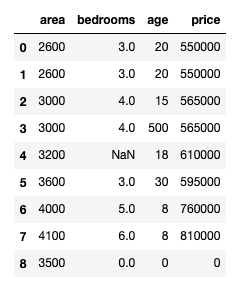
After running, the data frame is displayed.
DataFrames: DataFrames are two-dimensional structures, meaning they have rows and columns, similar to a table in a relational database or an Excel spreadsheet.
Deleting Columns
In the data frame, you can delete the column using the del keyword.
del df["bedrooms"]
You can also delete columns using the drop() function.
df = df.drop("bedrooms", axis=1)
df = df.drop(columns=["bedrooms", "age"])

# To delete the column without having to reassign df
df.drop("bedrooms", axis=1, inplace=True)
df.drop(["bedrooms", "age"], axis=1, inplace=True)
An axis=1 means, the drop function considers the column, if you put an axis=0 then it considers the rows of the data frame.
You can also drop columns using the index numbers. The index starts from zero (0).
df = df.drop(df.columns[[0, 1]], axis=1)
Deleting Rows
Drop duplicate rows: To drop duplicate rows from a data frame, you can use the drop_duplicates() function.
df = df.drop_duplicates()
Drop rows with the condition: Use the drop() function, which takes the data frame variable name with an array.
df = df.drop(df[df.age == 0].index)
df = df.drop(df[(df.age == 20) & (df.price == 550000)].index)
Drop all rows with NULL values from the data frame: To drop null value rows from the data frame, use the dropna() function.
df = df.dropna()
Replacing Missing Values
Replace the mean for all null values.
Check the mean of all columns, use the mean() function.
Using the fillna() function, replace the mean for all rows.
print(df.mean())
df = df.fillna(df.mean())
Complete Example Code:
import pandas as pd

df = pd.read_csv("home_prices.csv")

# delete column
del df["bedrooms"]

df = df.drop("bedrooms", axis=1)
df = df.drop(columns=["bedrooms", "age"])

# To delete the column without having to reassign df
df.drop("bedrooms", axis=1, inplace=True)
df.drop(["bedrooms", "age"], axis=1, inplace=True)

# df.columns is zero-based pd.Index
df = df.drop(df.columns[[0, 1]], axis=1)

# drop duplicates
df = df.drop_duplicates()

# drop with condition
df = df.drop(df[df.age == 0].index)
df = df.drop(df[(df.age == 20) & (df.price == 550000)].index)

# drop null value rows
df = df.dropna()

# ----------- Handling Missing Values -----------
# replace mean for all null values
print(df.mean())
df = df.fillna(df.mean())
Handling Outliers:
- Outliers are data points that differ significantly from the majority of the data.
- They can be unusually high or low values, compared to other observations in the dataset.
- Outliers can occur due to variability in the data, measurement errors, or experimental errors.
- Identifying and handling outliers is crucial in machine learning because they can significantly impact the performance of models.
In observation, the age of the home 500 years is an outlier.
Because 500 is a high value as compared to other observations in the dataset.
Check Outliers:
Using a scatter plot from the matplotlib library, check outliers in the dataset.
import pandas as pd
import matplotlib.pyplot as plt

df = pd.read_csv("home_prices.csv")

plt.xlabel("Area")
plt.ylabel("Age")

x = df["area"]
y = df["age"]
plt.scatter(x, y, color="purple", marker="*")
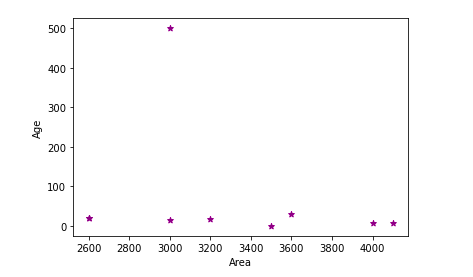
In this scatter plot, you can see that one data point is away compared to other observations in the dataset. This data point is 500 years age of the home.
Remove Outliers:
Now, drop this data point row from the data set. Drop this index 3 row from the data frame.
For that, use the drop() function and pass the 3-row index in the array, and axis=0.
import pandas as pd
import matplotlib.pyplot as plt

df = pd.read_csv("home_prices.csv")

df = df.drop([3], axis=0)

plt.xlabel("Area")
plt.ylabel("Age")

x = df["area"]
y = df["age"]
plt.scatter(x, y, color="purple", marker="*")
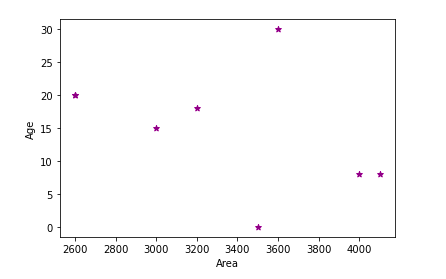
After running this code, the outlier is removed from the scatter plot.
When your data size is large, you can use the conditions in the drop() function to drop the outliers.