ML Introduction
Preprocessing
Regression
Classification
Polynomial Regression
- Polynomial Regression algorithm that models the relationship between a dependent variable and independent variable as nth degree polynomial.
- It is also called the special case of Multiple Linear Regression in machine learning.
- It is a linear model with some modifications to increase the accuracy.
- The dataset used in Polynomial regression for training is non-linear in nature.
Equation of Polynomial Regression
$$ y = a_0 + a_1x_1 + a_2x_1^1 + a_3x_1^2 + ... + a_nx_1^n + ε $$
- = dependent variable (target variable).
- = the intercept (on the y-axis) of a regression line.
- = the coefficients of a regression line.
- = independent variable with increment degree (predictor variable).
- = the model error.
Problem statement: Build a machine learning model that can predict employee salary based on his experience.
- Predict the salary of an employee with 5.5 years of experience.
- Predict the salary of an employee with 7 years of experience.
- Predict the salary of an employee with 8.5 years of experience.
import pandas as pd
from sklearn.linear_model import LinearRegression
from sklearn.preprocessing import PolynomialFeatures

df = pd.read_csv("position_wise_salary.csv")

x = df[["Level"]].values
y = df["Salary"]

polynomial_regressor = PolynomialFeatures(degree=4)
x_polynomial = polynomial_regressor.fit_transform(x)

linear_regressor_model = LinearRegression()
linear_regressor_model.fit(x_polynomial, y)

print(linear_regressor_model.predict(polynomial_regressor.fit_transform([[5.5]])))
print(linear_regressor_model.predict(polynomial_regressor.fit_transform([[7]])))
print(linear_regressor_model.predict(polynomial_regressor.fit_transform([[8.5]])))
[132148.43750003]
[184003.49650349]
[387705.69274467]
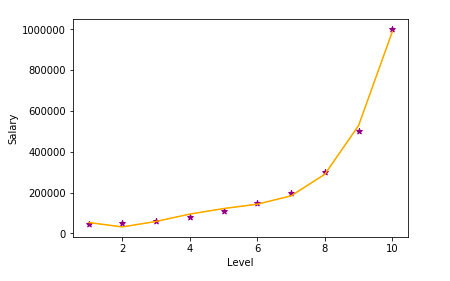
Problem statement: Draw a scatter plot and show the level-wise salary distribution of employees.
import matplotlib.pyplot as plt

plt.xlabel("Level")
plt.ylabel("Salary")
plt.scatter(x, y, color="purple", marker="*")
plt.plot(x, linear_regressor_model.predict(x_polynomial), color="orange")