ML Introduction
Preprocessing
Regression
Classification
Features, Labels, & Data Points in Machine Learning
Features, Labels, and Data Points
Features, Labels, and Data Points
Understanding features, labels, and data points is essential for grasping how machine learning models are built and used.
1. Features
Definition:
- Features are individual measurable properties or characteristics of the data.
- They are the input variables the machine learning model uses to make predictions.
Characteristics:
- Quantitative or Qualitative: Features can be numerical (e.g., age, height) or categorical (e.g., gender, color).
- Independent Variables: In machine learning, features are often referred to as independent variables because they are used to predict the dependent variable (label).
Examples:
- House Price Prediction: features could include the number of bedrooms, square footage, and location.
- Customer Churn Prediction: the features are Age, contract length, and monthly charges.
- Image Classification: the features are Pixel values and color intensity.
2. Labels
Definition:
- Labels are the output variable that the model is trained to predict.
- They are also known as the dependent variable, target, or output.
Characteristics:
- Known Outcomes: In supervised learning, labels are known outcomes for the training data.
- Ground Truth: Labels represent the ground truth against which the model’s predictions are compared.
Examples:
- House Price Prediction: The actual price of the house.
- Customer Churn Prediction: Whether the customer churned (yes/no).
- Image Classification: The category of the object in the image (e.g., cat, dog).
3. Data Points
Definition:
- A data point, also known as an instance, is a single row of data that includes values for all the features and, if applicable, the label.
- Each data point represents one observation or record in the dataset.
Characteristics:
- Complete Record: Contains all the features and the corresponding label for supervised learning tasks.
- Unit of Analysis: Each data point is an individual unit of analysis for the machine learning model.
Examples:
- House Price Prediction: The Data Points are: {Bedrooms: 3, Square Footage: 2000, Location: Suburban, Price: $350,000}
- Customer Churn Prediction: The Data Points are: {Age: 30, Contract Length: 12 months, Monthly Charges: $50, Churn: No}
- Image Classification: The Data Points are: {Pixel Values: [0, 255, 128, ...], Label: Cat}
Relationships Between Features, Labels, and Data Points
1. Features are the Inputs:
- Features provide the input information needed by the model to make predictions.
2. Labels are the Outputs:
- Labels are the outcomes that the model aims to predict.
- In supervised learning, the model learns to map features to labels.
3. Data Points are the Complete Observations:
- Each data point is a complete observation that includes both features and, in supervised learning, the label.
- Data points are the fundamental units used to train and test machine learning models.
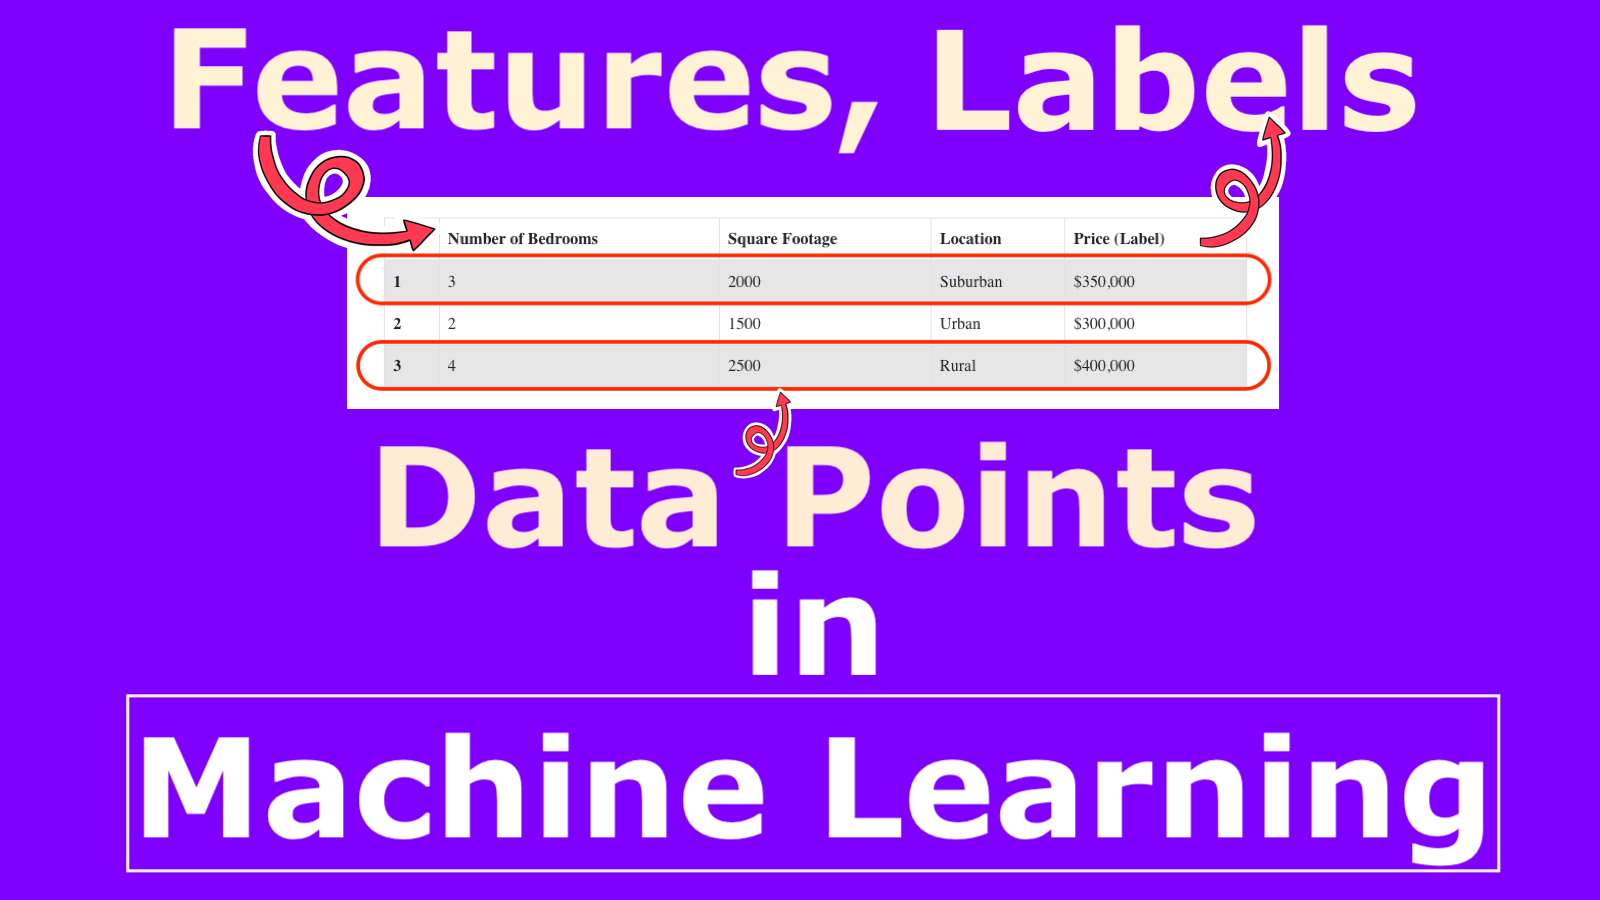
Example: House Price Prediction Dataset
Consider a dataset used to predict house prices:
| Id | Number of Bedrooms | Square Footage | Location | Price (Label) |
|---|---|---|---|---|
| 1 | 3 | 2000 | Suburban | $350,000 |
| 2 | 2 | 1500 | Urban | $300,000 |
| 3 | 4 | 2500 | Rural | $400,000 |
In this example:
- Features are: Number of Bedrooms, Square Footage, Location
- The label is: Price
- The Data Point are (First Row): {Number of Bedrooms: 3, Square Footage: 2000, Location: Suburban, Price: $350,000}
Example: Customer Churn Prediction Dataset
Consider a dataset used to predict customer churn:
| Id | Age | Contract Length | Monthly Charges | Churn (Label) |
|---|---|---|---|---|
| 1 | 30 | 12 months | $50 | No |
| 2 | 45 | 24 months | $70 | Yes |
| 3 | 25 | 6 months | $40 | No |
In this example:
- The Features are: Age, Contract Length, Monthly Charges
- The Label is: Churn
- The Data Point are (First Row): {Age: 30, Contract Length: 12 months, Monthly Charges: $50, Churn: No}